Spectral analysis of heart rate variability
SA HRV (Spectral Analysis of Heart Rate Variability) specifies information about the regular oscillations that make up HRV. This makes it possible to convert the time series created by the R-R intervals into a frequency domain that is able to detect these periodic HRV components. For the spectral analysis of heart rate variability, either an autocorrelation method is used, which compares the current values of the input time series with values of the same time series but periodically delayed, or a fast Fourier transform, decomposing the input time series into the sum of harmonic signals with different frequency, amplitude and phase (Stejskal & Salinger, 1996; Salinger & Gwozdziewicz, 2008).
The SA HRV method characterizes only the harmonic components of the frequency spectrum, any non-harmonic components participating in the HRV are not detectable by the SA HRV method. The specified series of numerical data on the size of R-R intervals is converted into a frequency image in the range from 20 mHz to 500 mHz (representing 0.5 to 30 periodic changes per minute).
Analysis of short-term recording (5 minutes and 300 beats) allows to distinguish 3 main spectral components:
VLF (very low frequency) - a very slow frequency in the range of 20 - 50 mHz, the power of which is associated with thermoregulatory sympathetic activity of blood vessels, the level of circulating catecholamines and oscillations of the renin - angiotensin system.
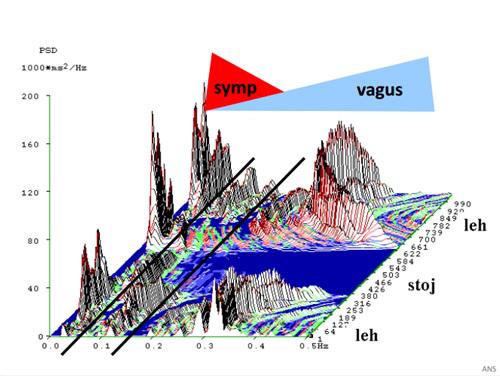
LF (low frequency) - a slow frequency in the range of 50 - 150 mHz, also referred to as the Mayer pressure wave, is most affected by baroreflex sympathetic activity and corresponds to slow oscillations of arterial pressure variability. However, they must not be considered as an overall indicator of sympathetic activity.
HF (high frequency) - high frequency exceeding the limit of 150 mHz, is influenced exclusively by efferent vagal activity. The HF component is called the respiratory wave, because the frequency of oscillations around 250 - 300 mHz correlates with the respiratory rate. Increasing tidal volume increases the size of the HF component, while increasing respiratory rate shifts it to the right and reduces it, so both respiratory rate and volume directly affect the HRV power spectrum (Stejskal & Salinger, 1996).
The power values of the individual components are expressed in absolute values (ms2), as well as the values of the maximum amplitude (maximum spectral power density) (ms2 / Hz). In terms of the relationship to ANS (Autonomic nervous system), relative indicators have a greater informative value, expressed on the one hand as a percentage of the total power or narrowed spectrum from 50 to 500 mHz as the so-called normalized units. To reduce the negative impact of a decrease in variability at an increased heart rate, the coefficient of variation of the respective CCV component is used (Hayano et al., 1991).
During sympathetic activation, the absolute value of all components decreases. If we express the values of individual components in relative units, we find an increase in the representation of the LF component and the opposite dynamics of the LF / HF ratio. In healthy individuals, the passive or active position causes a decrease in total spectral power, an increase in the LF component (in relative units) and a decrease in the HF component, and thus an increase in the LF / HF ratio. Spectral power with a frequency higher than 150 mHz can therefore be considered as an indicator of parasympathetic activity, the lower frequency (below this limit) corresponds to oscillations of both parasympathetic and sympathetic, when the fundamental dominance of parasympathetic in total spectral power decreases. The region around 100 mHz indicates increased baroreceptor activity (Stejskal & Salinger, 1996).