Under the covers of mySASY: time vs. frequency domain
What is the difference between monitoring heart rate variability (HRV) using Time and Frequency domains? What seems like a scientific game with words and a slight nuance in methodology is a key difference that sets mySASY apart from the competition.
We will try to give you a basic idea using the analogy of GPS car navigation:
The Time domain shows whether to turn right or left right now.
Frequency will also show you where you are now and where you are going in the long term.
A big topic both in terms of scientific research and also among the general public thanks to the increasing popularity of applications athletes of all levels. Scientists have long been clear in this regard * (source). But what about the average Joe? Here the situation is different. Everyone has an opinion and it is difficult to take a stance without the necessary knowledge of the issue. We want to introduce you to our opinion and give you the insight into the scientific part. We will try to be brief and correct.

Key difference in measurement methodology
In principle, HRV focuses on monitoring the state of the autonomic nervous system (ANS) controlling an organism that has 2 equally important branches (parts):
- Parasympathetic (regeneration / Refuelling)
- Sympathetic (activation / Consumption)
If we want to correctly describe its activity, then we must talk about:
- Total power (total number of impulses flowing through the nervous system)
- Activity of the parasympathetic (regeneration / Refuelling)
- Activity of the Sympathetic (activation / Consumption)
In this context, we show the difference between the evaluation using the Time domain and Frequency domain (Spectral analysis) method in the table:
| Parameter | Time domain | Frequency domain | Illustration in mySASY | ||
|---|---|---|---|---|---|
| Total power | (approximately?) | yes | circle size | ||
| Parasympathetic | yes | yes | X-axis | ||
| Sympathetic | no | yes | Y-axis |
The Time domain gives about 50% of information about ANS, Frequency domain (Spectral analysis) 95% (a certain degree of uncertainty must always be perceived - we monitor the biological system, not the machine).
The question arises. Is the time domain usable? Is 50% enough information?
The answer is: For whom and for what purpose. We will try to show it better by comparing the results of mySASY measurements of three athletes.
Case Study
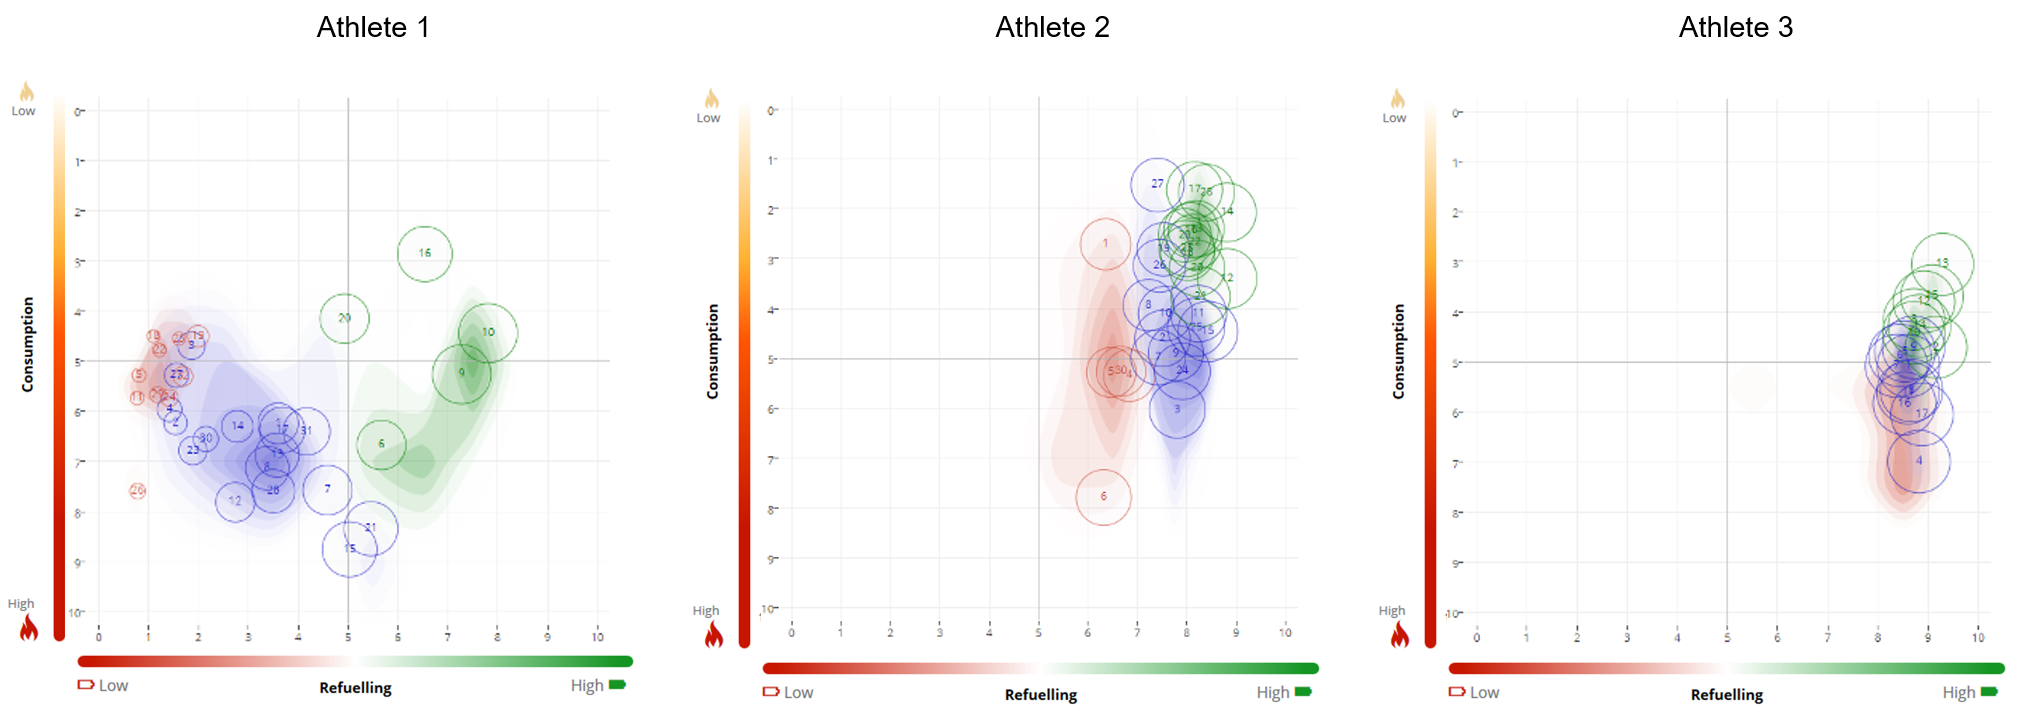
Before evaluating the individual examples, let's just recall what we would see in results if we will use only the Time domain: circle size + very approximate movement along the X axis.
Using Frequency domain (mySASY) we will see:
Athlete 1 responds to the load primarily with a dramatic decrease in Total Power (circle size) associated with a change in Parasympathetic activity (energy replenishment - movement along the X axis). It's all quite a negative signal, which "already" can be captured using the Time domain. However Time domain is not able to capture long-term (very desirable) profile (spectrum) modification.
Athlete 2 already has a relatively stable ANS performance, the regeneration branch is almost always active (along the X axis we see only minimal movement), the predominance of controlling is by sympathetic (movement along the Y axis). The reactions is almost ideal. The time domain would give a limited amount of information. Especially in the long-term development.
Athlete 3 very stable and high Total Power - ANS performance, the regeneration branch is almost always active. By this type of results movement, the Time domain does not solve much (it will be rather misleading) both in the current proceedings and in the longer term.
Monitoring of long-term development and changes in ANS activity by using mySASY Training Profile and population standards.
Most (we do not know all systems in the world) evaluation approaches using Time domains are based exclusively on comparing the current results of an individual with his previous results. Thanks to that they are able to say - it's better than usual today, it's worse than usual today. This can also be done using the Frequency domain (Spectral analysis) (in mySASY this is represented by the color of the results and the compensation level).
The display of the results on the available population standard informs the user about the overall quality of management and, above all, whether it is moving in the right direction in the long run = your mySASY Training Profile. The examples from Case study and their comparison show how positively the adaptive capacity could be developed in Athlete 1 (compared to other profiles). On the contrary, on the example of Athlete 3 it is possible to demonstrate above all what profile would indicate the minimization of the risk of chronic deterioration of the condition, because he can hardly improve his adaptation disposition (not to be confused with current performance).
We believe that we have brought you enough information for you to decide for yourself how to work with the training and its evaluation with the help of HRV. mySASY brings you a unique tool to see the effect of your training with maximum accuracy - spectral analysis (ie frequency domain). Both currently and from a long-term perspective thanks to the mySASY Training Profile.
Additional information: we also calculate the parameters of the Time domain and we have an accurate idea of what information it brings and which they can never provide.
* Malik, M., Camm, A. J. Heart rate variability Wiley-Blackwell; 1 edition. Heart rate variability, Standards of measurement, physiological interpretation, and clinical use Task Force of The European Society of Cardiology and The North American Society of Pacing and Electrophysiology, European Heart Journal (1996) 17, 354–381.